
Graphical statistics report WordPress plugin creates the graphical report about monthly user registration, monthly post, monthly comment, category wise post count in the admin. All the statistics will be displayed with the help of fusion char. This is a very useful plugin to trace your website statistics.
Features of this plugin
- Monthly user registration graphical graph.
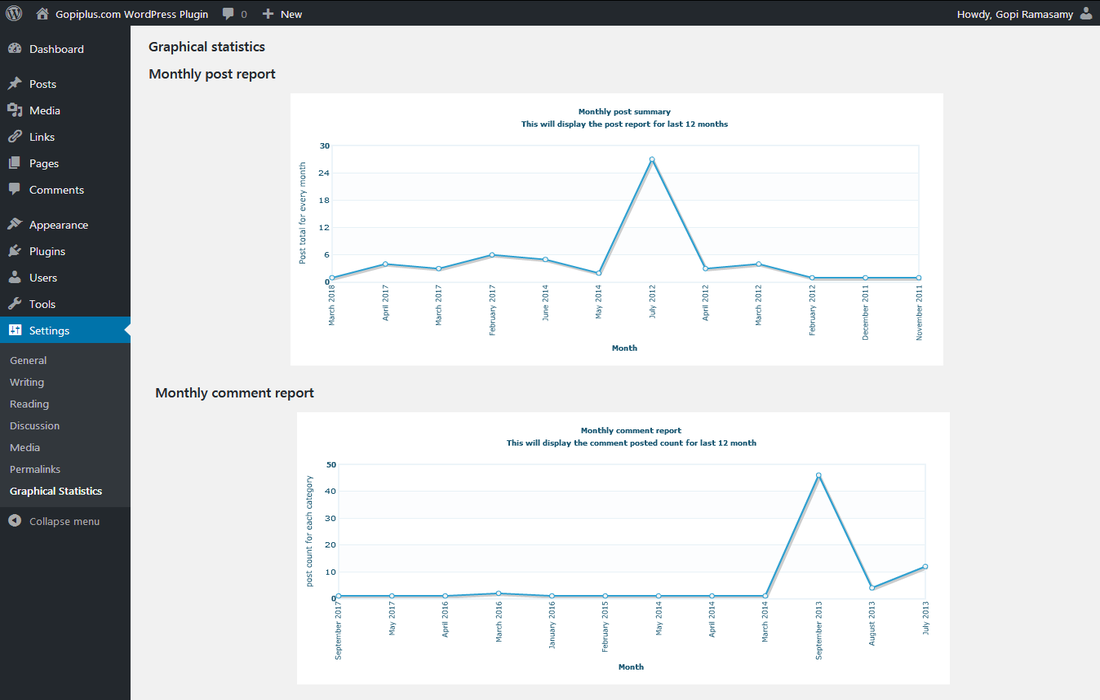
- Monthly post graphical report.
- Monthly comments posted graphical report.
- Category wise post graphical report.
Note: This plugin is for admin reports, so the live working demo is not available instead see the admin screenshot below. You may also be interested in the Graphical admin report WordPress plugin.
To see the report (Plugin configuration)
- Activate the plugin.
- Go to Graphical statistics link under setting menu to see the report graph.
Frequently asked questions
Q1. How to display this plugin to the front end?
No, this plugin is only for admin reports. see the below screenshot.
Installation instruction
Method 1
- Download the plugin from download location.
- Unpack the graphical-statistics-report.zip file
- Extract the /graphical-statistics-report/ folder.
- Drop the plugin folder into your ‘wp-content/plugins’ folder.
- In WordPress administration panels, click on plugin from the menu.
- You should see your new graphical statistics report plugin listed.
- To turn the WordPress plugin on, click activate.
Method 2
- Go to add new menu under Plugins tab in your WordPress admin.
- Search graphical statistics report plugin using search option.
- Find the plugin and click Install Now link.
- Finally click activate plugin link to activate the plugin.
Method 3
- Download the plugin graphical-statistics-report.zip from download location.
- Go to Add New menu under Plugins tab in your WordPress admin.
- Select upload link (top link menu).
- Upload the available graphical-statistics-report.zip file and click install now.
- Finally click activate plugin link to activate the plugin.
Screen shorts
In your WordPress administrator section go to the Settings menu and select the Graphical statistics menu to configure this plugin.
Plugin official page
http://www.gopiplus.com/work/2010/07/18/graphical-statistics-report/
Download link
http://www.gopiplus.com/work/2012/06/23/graphical-statistics-report-wordpress-plugin-download-link/